๐Ÿ  Home
๐Ÿงญ Your Path โ–ผ
๐Ÿ” Members Zone My Budget ๐Ÿ“ฑ My Daily Pulse โ€” Mobile App
Phase 3 of 3 โ€” The Final Phase

.
.

Before you trade the market, trade your plan. Before you trade your plan, master the tools. This is where precision meets discipline.

๐Ÿƒ Run Phase

The Live Trading Program

Four milestone phases leading you from technical mastery to live trading with real money, real rules, and a real plan.

Click a phase to begin your journey
๐Ÿ“ˆ
Phase 1
Technical Analysis Mastery
โ–ผ
๐Ÿ›๏ธ
Phase 2
Macro & Economic Awareness
โ–ผ
๐Ÿ’ฐ
Phase 3
Live Trading โ€” Small Size
โ–ผ
๐ŸŽฏ
Phase 4
Consistent & Scalable
โ–ผ
๐Ÿง  Mind Over Market

Trading Psychology & Truth

Psychology accounts for 80%+ of trading success. Understanding how your mind and body respond to risk is foundational โ€” master yourself before you try to master the market.

1

โšก Your Brain Is Wired Against You

  • Your fight-or-flight response treats losing money like physical danger โ€” it's ancient wiring, not logic
  • The amygdala hijacks rational thought during drawdowns, pushing you to panic-sell or revenge-trade
  • Awareness is the first defense โ€” you can't fix what you don't see happening in real time
๐Ÿ“บ The Trading Channel โ€” 20,000 Year Old Brain VS. Trading Psychology
2

๐Ÿซ€ The Physiology of Risk

  • Cortisol spikes during losses impair decision-making โ€” your body enters survival mode
  • Dopamine loops from wins create overconfidence and gambling behavior โ€” the high is addictive
  • Sleep deprivation, stress, and fatigue compromise every trade โ€” never trade in a compromised state
  • Your body keeps score: physical discipline = trading discipline
๐Ÿ“บ Maverick Trading โ€” Brain Chemistry & Trading Psychology
3

๐Ÿชค Cognitive Biases That Destroy Traders

  • Loss aversion โ€” holding losers too long, cutting winners too short
  • Confirmation bias โ€” only seeing what supports your position
  • Recency bias โ€” the last trade dictates the next trade's emotion
  • Overconfidence โ€” a winning streak is not a skill streak
๐Ÿ“บ The Duomo Initiative โ€” The Real Reason Traders Exit Trades Too Soon
4

๐Ÿ”‘ Principles of Truth in Trading

  • Honesty โ€” Admit when you're wrong. Cut the loss.
  • Accuracy โ€” Journal every trade with real data, not narratives
  • Consistency โ€” Follow your system even when it feels wrong
  • Transparency โ€” Be honest about your P&L. No hiding losses.
  • Integrity โ€” Trade your plan when no one is watching
๐Ÿ“บ The Duomo Initiative โ€” How I Beat the Mental Game of Trading (20+ Years)
5

๐ŸŽฏ The Disciplined Trader

  • Build a pre-trade checklist rooted in truth โ€” check your state before you check the chart
  • Post-trade review: what did I feel vs. what did I do?
  • The process matters more than any single trade โ€” systems beat impulses
  • Master yourself before you try to master the market
๐Ÿ“บ Mark Douglas โ€” Think Like a Professional Trader (The Disciplined Trader)
๐Ÿ“ˆ The Technical Edge

Technical Analysis Lab

The indicators, patterns, and frameworks that help you identify high-probability setups โ€” tools, not crystal balls.

โš™๏ธ Core Indicators โ€” Learn These First

Moving Average (MA)
Trend
Smooths price data over N periods to reveal the underlying trend. The 20, 50, and 200-day MAs are the most widely watched levels in all of finance.
SMA = Sum(Close, N) / N
EMA weights recent prices more
โœ… Use for: Trend direction, dynamic support/resistance, golden/death cross signals
๐Ÿ“Š Open MA on TradingView โ†’
RSI โ€” Relative Strength Index
Momentum
Measures momentum on a 0โ€“100 scale. Above 70 = overbought (potential pullback). Below 30 = oversold (potential bounce). Divergence from price is the most powerful signal.
RSI = 100 โˆ’ (100 / (1 + RS))
RS = Avg Gain / Avg Loss (14 periods)
โœ… Use for: Overbought/oversold conditions, divergence signals, momentum confirmation
๐Ÿ“Š Open RSI on TradingView โ†’
MACD
Momentum + Trend
Moving Average Convergence Divergence. When the MACD line crosses above the signal line = bullish momentum. Below = bearish. Histogram shows momentum strength.
MACD = EMA(12) โˆ’ EMA(26)
Signal = EMA(9) of MACD
โœ… Use for: Momentum shifts, crossover signals, divergence from price
๐Ÿ“Š Open MACD on TradingView โ†’
Bollinger Bands
Volatility
Three lines: middle MA + upper/lower bands at 2 standard deviations. "Band squeeze" signals low volatility before a breakout. Price hitting the upper band โ‰  automatically overbought.
Middle = 20-day SMA
Upper/Lower = SMA ยฑ 2ฯƒ
โœ… Use for: Volatility measurement, squeeze breakout setups, mean reversion
๐Ÿ“Š Open Bollinger Bands on TradingView โ†’
Volume + Volume Profile
Volume
The most honest indicator โ€” it never lies. Volume confirms price moves. A breakout on low volume is weak. High volume at key levels shows institutional activity.
Volume Profile shows where most
trading happened at each price level
โœ… Use for: Confirming breakouts, finding high-volume nodes, identifying institutional interest
๐Ÿ“Š Open Volume on TradingView โ†’
VWAP
Volume + Price
Volume-Weighted Average Price. The average price all day weighted by volume. Institutions use it as a benchmark โ€” price above VWAP = bullish intraday bias, below = bearish.
VWAP = ฮฃ(Price ร— Volume) / ฮฃ(Volume)
Resets each trading day
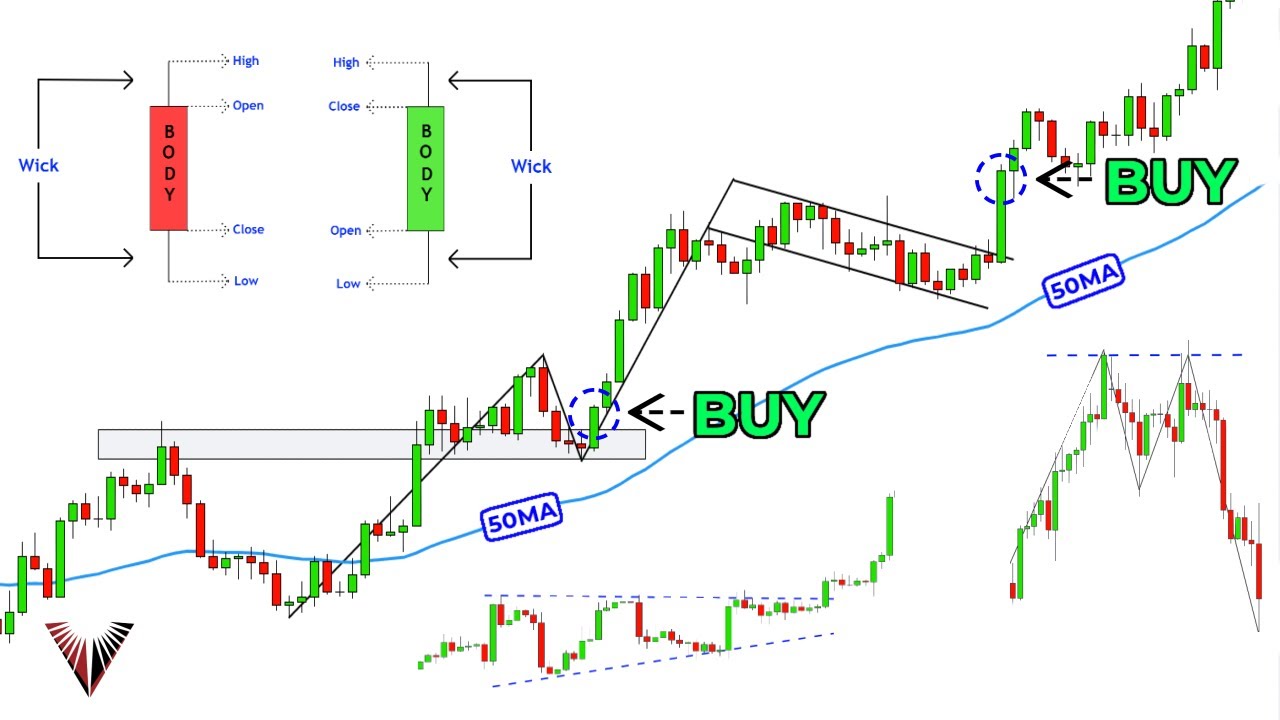
โœ… Use for: Intraday bias, institutional benchmark, mean reversion trades
๐Ÿ“Š Open VWAP on TradingView โ†’

๐Ÿ•ฏ๏ธ Key Candlestick Patterns

Hammer
Bullish Reversal
Small body at top, long lower wick. Sellers tried to push lower but buyers rejected the move. Bullish when it forms after a downtrend at support.
Doji
Indecision
Open and close nearly identical. Neither buyers nor sellers won. Context matters โ€” doji at resistance after an uptrend signals potential reversal.
Engulfing
Reversal Signal
A candle that completely "engulfs" the previous candle's body. Bullish engulfing after downtrend = strong reversal signal. Best with high volume confirmation.
Morning / Evening Star
3-Candle Reversal
3-candle reversal pattern. Morning star (bullish) = big down candle, small body, big up candle. Evening star is the bearish inverse. High reliability at key levels.
Shooting Star
Bearish Reversal
Small body at bottom, long upper wick. Buyers pushed price up but sellers rejected the move. Bearish when it forms after an uptrend at resistance.
Inside Bar
Consolidation / Breakout
A candle whose range falls completely within the previous candle's range. Signals consolidation before a breakout. Direction of breakout determines the trade.
Pin Bar (Wick Rejection)
Key Level Rejection
Long wick with a small body at the opposite end. Shows strong rejection of a price level. One of the cleanest entries when it forms at major support or resistance.
Three White Soldiers
Strong Bullish Trend
Three consecutive bullish candles with small wicks, each closing progressively higher. Strong uptrend confirmation, especially after a period of consolidation or downtrend.

๐ŸŽฏ The Setup Framework โ€” Before Every Trade

1๏ธโƒฃ
Macro Context
Is the macro environment favorable for this type of trade? Are we in a bull or bear market? What's the broader sector doing?
2๏ธโƒฃ
Daily Chart First
Start with the daily timeframe. Identify the major trend, key support/resistance levels, and where price is relative to the 20/50/200 MA.
3๏ธโƒฃ
Zoom In for Entry
Drop to the 1H or 15M chart to find the precise entry. Wait for your pattern confirmation โ€” candlestick signal + volume. Never chase.
4๏ธโƒฃ
Define Risk First
Before entering, define your stop-loss and calculate position size. You must know your max dollar loss before the trade. No entry without a stop.
๐Ÿ›๏ธ Macro Matters

Understanding the Economy

Every trade happens inside a macro environment. Learn to read economic indicators and align your strategy with the bigger picture.

๐Ÿฆ Federal Reserve Rate Cycle โ€” How It Affects Markets

๐Ÿ“‰
Rate Cuts Begin
Fed cuts to stimulate growth. Stocks often rally, bonds rise, USD weakens. Growth and tech stocks lead.
๐Ÿš€
Expansion
Economy grows, employment rises, consumer spending up. Cyclical sectors (industrials, consumer disc.) outperform.
๐ŸŒก๏ธ
Inflation Rises
Demand drives prices up. Commodities, energy, and real assets become attractive inflation hedges.
๐Ÿ“ˆ
Rate Hikes Begin
Fed raises rates to cool inflation. Borrowing costs rise, growth stocks get hit hardest. Value and financials often outperform.
๐ŸงŠ
Slowdown
High rates slow the economy. Defensive sectors (utilities, healthcare, staples) tend to hold up better as growth stalls.

Track live Fed rate probabilities: CME FedWatch Tool โ†—  |  Source: federalreserve.gov โ†—

๐Ÿ“Š Key Economic Indicators Every Trader Tracks

๐Ÿ’น
CPI โ€” Consumer Price Index
Measures the change in prices paid by consumers for goods and services. The Fed's primary inflation gauge. Hot CPI = risk of more rate hikes = headwind for stocks.
๐Ÿ”ด High Market Impact
Released monthly by BLS ยท bls.gov โ†—
๐Ÿ‘ท
NFP โ€” Non-Farm Payrolls
Monthly jobs report showing how many jobs were added or lost outside agriculture. Strong NFP = healthy economy. Too strong = inflation concerns = potential rate hikes.
๐Ÿ”ด High Market Impact
Released 1st Friday monthly by BLS ยท bls.gov โ†—
๐Ÿ“ฆ
PPI โ€” Producer Price Index
Measures inflation at the producer level. PPI often leads CPI โ€” rising producer prices eventually get passed to consumers. Leading inflation indicator.
๐ŸŸก Medium Market Impact
Released monthly by BLS ยท bls.gov โ†—
๐Ÿ—๏ธ
GDP โ€” Gross Domestic Product
Total economic output of the U.S. economy. Two consecutive quarters of negative GDP = recession. Strong GDP supports corporate earnings and stock prices.
๐ŸŸก Medium Market Impact
Released quarterly by BEA ยท bea.gov โ†—
๐Ÿ 
Housing Data
Existing home sales, housing starts, building permits, and Case-Shiller index. Housing is both a leading economic indicator and a consumer confidence gauge.
๐ŸŸข Lower Market Impact
Released monthly by Census Bureau / NAR
๐Ÿ›๏ธ
Retail Sales
Monthly measure of consumer spending on goods. Consumer spending drives ~70% of U.S. GDP. Strong retail sales = economic momentum. Weak = caution.
๐ŸŸก Medium Market Impact
Released monthly by Census Bureau ยท census.gov โ†—

๐Ÿ”„ Sector Rotation โ€” Which Sectors Lead in Each Cycle

Early Expansion
Technology, Financials
Rate cuts fuel growth stocks. Banks benefit from increased lending activity.
Full Expansion
Industrials, Consumer Disc.
Strong consumer confidence drives spending and manufacturing activity.
Late Cycle / Inflation
Energy, Materials, Real Estate
Hard assets hedge inflation. Energy demand peaks as economy runs hot.
Contraction / Recession
Utilities, Healthcare, Staples
Defensive sectors โ€” people still pay bills, buy medicine, and buy food regardless.
๐ŸŽ“ Learn From the Pros

Run Phase Academy

The creators and resources that will sharpen your edge โ€” technical analysis masters, macro thinkers, and traders who've done it consistently.

๐ŸŽ“ Featured Lesson

Watch & Learn: Educational Breakdown

A clear, beginner-friendly walkthrough โ€” the kind of content that actually makes things click.

Watch educational breakdown on YouTube
โ–ถ
Watch on YouTube

Essential Lessons โ€” Watch in Order

These aren't random YouTube searches. Each video was selected because it teaches one specific thing clearly. Watch them in order โ€” each builds on the last.

Lesson 1 โ€” Start Here
Technical Analysis for Beginners

Why this matters: Before you learn any indicator, you need to understand what a chart is actually telling you. This walkthrough builds your visual literacy โ€” the ability to read price action like a language.

Watch on YouTube โ†’
Lesson 2 โ€” Know Your Brain
Your 20,000-Year-Old Brain vs. Trading

Why this matters: Your fight-or-flight system treats losing money like physical danger. Until you understand this wiring, every drawdown will hijack your decision-making. Watch this before you ever risk real money.

Watch on YouTube โ†’
Lesson 3 โ€” The Discipline Standard
Mark Douglas โ€” Think Like a Professional Trader

Why this matters: Mark Douglas wrote the book on trading psychology. This is the single most important video on this page. The process matters more than any single trade. Systems beat impulses. Discipline beats talent.

Watch on YouTube โ†’
Lesson 4 โ€” Price Structure
Support, Resistance & Trendlines

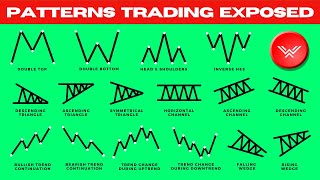
Why this matters: These are the most fundamental concepts in all of technical analysis. Support is where buyers step in. Resistance is where sellers push back. The trend is your friend โ€” until it breaks. Master these before touching an indicator.

Watch on YouTube โ†’

Go Deeper โ€” Channels & Resources

Once you've completed the lessons above, these are the channels and tools to keep learning from.

๐Ÿ›ก๏ธ Non-Negotiable Risk Management Rules

1
Never risk more than 1โ€“2% of your account on a single trade. A 10-trade losing streak (which happens to every trader) at 2% = 18% drawdown. Survivable. At 10% per trade = catastrophic.
2
Always define your stop-loss before you enter. If you don't know where you're wrong before you enter, you're gambling โ€” not trading. No exceptions.
3
Minimum 1:2 risk-to-reward ratio. Every trade should risk $1 to make at least $2. You can be right only 40% of the time and still be profitable with a 1:2 R:R.
4
No revenge trading. After a loss, walk away. Never add to a losing trade to "get even." The market owes you nothing. Each trade is independent.
5
Trading capital is separate from your life money. You completed the Crawl phase. Your emergency fund, retirement accounts, and budget are untouchable. Trading capital = money you can lose without consequence to your life.
โš ๏ธ Important Disclaimer: Everything on this page is educational content only โ€” not financial advice. Trading involves significant risk of loss. Past performance, backtests, and paper trading results do not guarantee future live trading results. Always do your own research, consult a licensed financial advisor for personalized guidance, and never trade with money you cannot afford to lose.

What's Your Next Step?

You have the tools. The question is: will you trade your plan with discipline โ€” or trade your emotions with hope? The difference is everything.

Not ready yet
Paper trade for 30 days
Journal every trade. Follow your rules exactly. If you can't do it with fake money, real money won't help.
Ready to start
Open a small live account
Dedicated trading capital only. Start with Phase 3 above. The goal is not profit yet โ€” it's executing your plan without deviation.
Already trading
Apply for mentorship
90 days of documented, disciplined trading? The waitlist is where 1-on-1 coaching begins.